Little Big Data Company
We based our LITTLE BIG DATA COMPANY project on our research about technology. We focused on such subtopics as surveillance capitalism, BigData, and micro-targeting, looking at these themes through the lens of ethical implications and the disbalance of power between the internet/social-media users and the companies that provide the services (and collect and sell the data of their users).
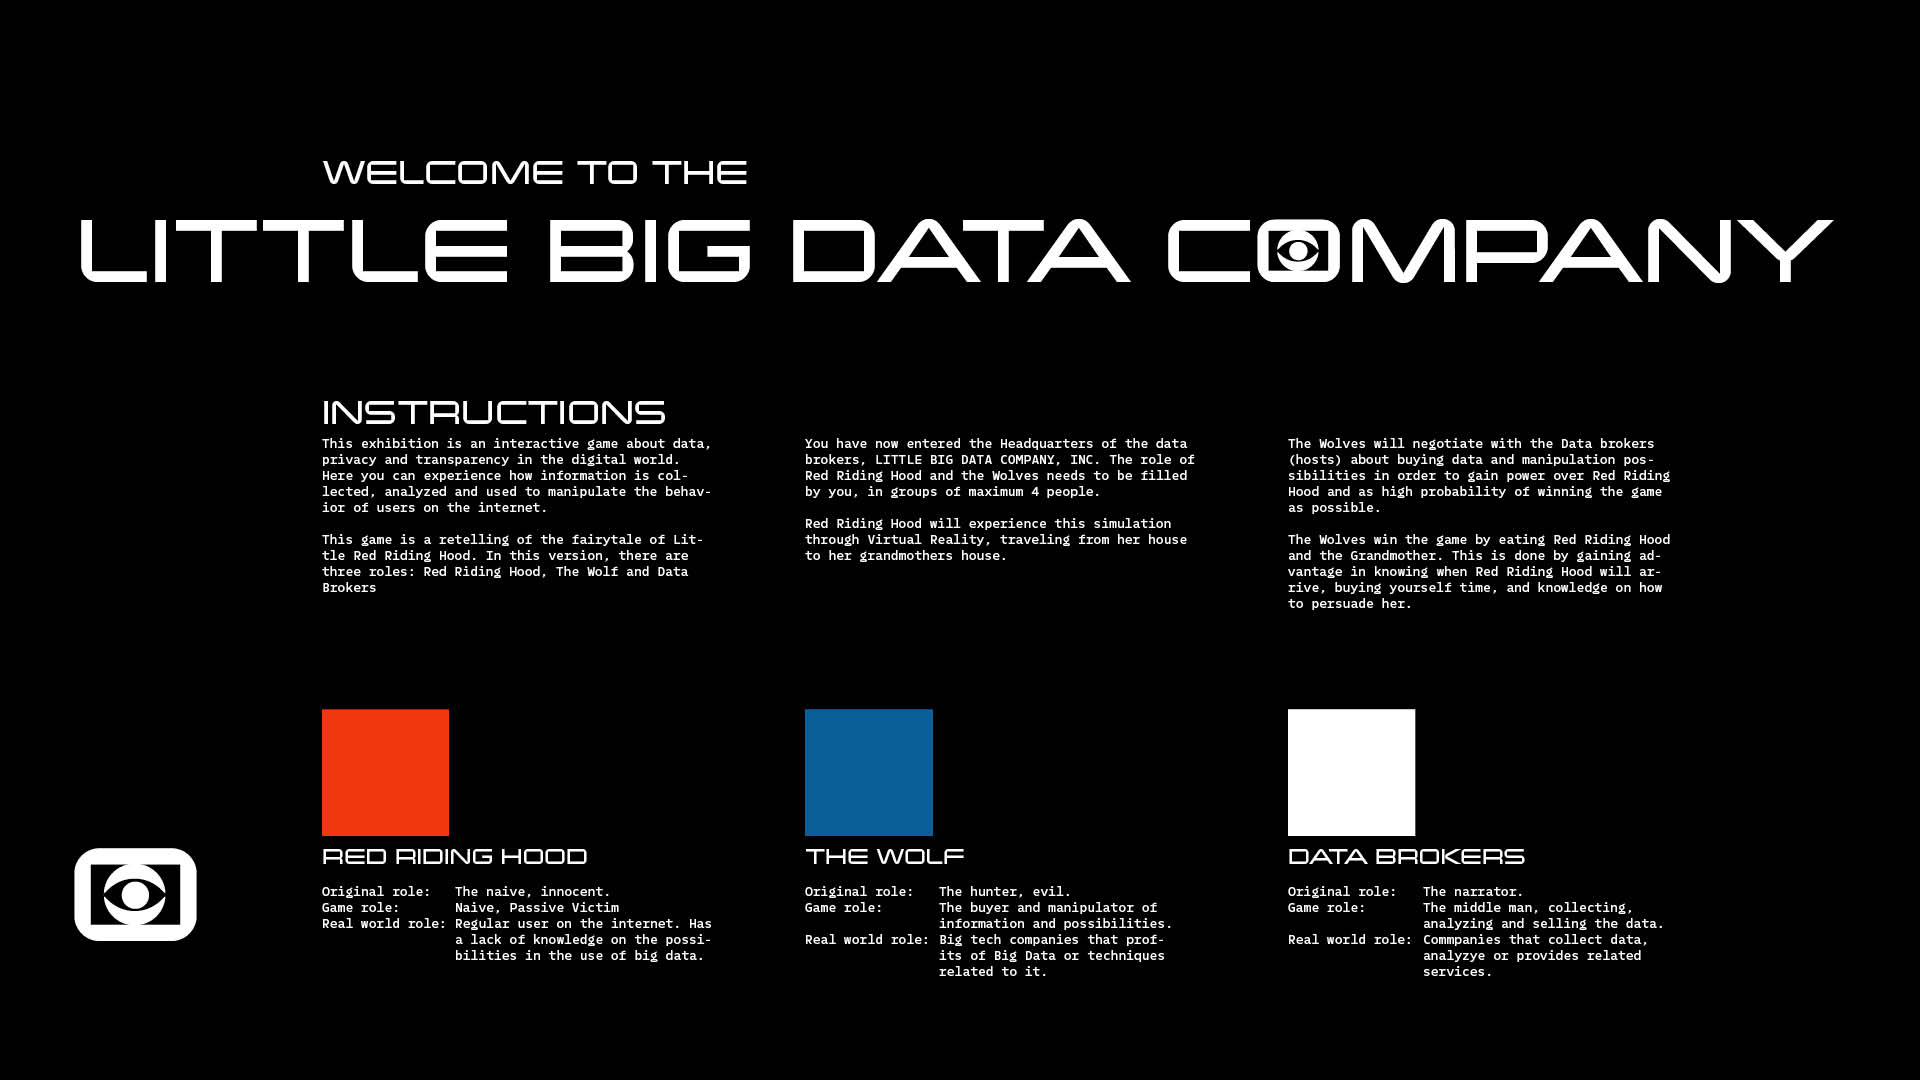
It is a role-playing experience based on the Little Red Riding Hood fairy-tale. The girl represents a naive internet user. The wolf represents the information buyer who uses it for his benefit, which is to eat both the grandma and the girl. However, there is a third role that we, the project creators, play. We are the data brokers. We know everything about the girl and are ready to sell it to anyone willing to pay. Are you ready?
Student works
MA1 DESIGN: Department of Design | Faculty of Fine Art, Music and Design, University of Bergen
THE GROUP
Alisa Rysaeva [Co-Project Leader, Communication Lead, Co-Technical lead: VR part]
Sara Westergaard Karlsen [Co-Project Leader, Documentation Lead, Co-Technical lead: interactive projection part]
Nathalie Piqué Kulsrud [Research Lead, Information Lead]
Kaho Suzuki [Design Lead, Visual Communication Lead]
TUTORS: Cheng Syun Tang, Philipp von Hase
PROGRAM: MA 1, Visual Communication, UiB
THE PROCESS
Week 1:
Our process has started with lots of discussions about what technology is, what issues are there, and what we are most interested in. After some time, we pinpointed five themes: power, behavior by design, responsibility/accountability, complexity (technology is not bad or good, it is both), transparency.
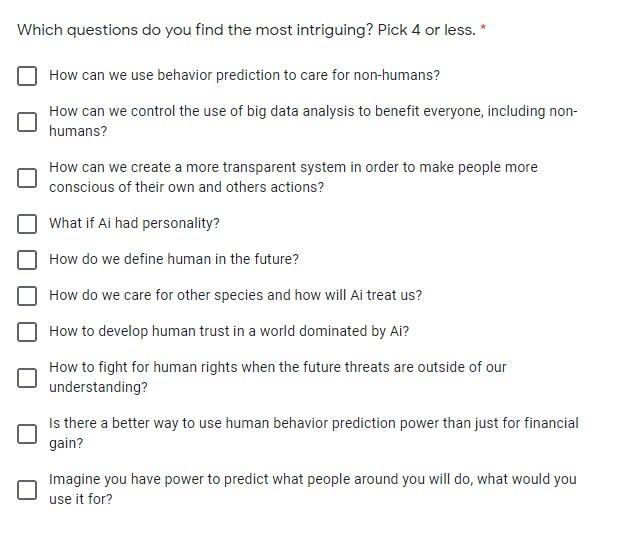
It was high time to narrow the theme down. To do that, we decided to make a list of more specific research questions and later pick one for further work. We ended up with 43 questions. After three rounds of democratic voting, we narrowed the list down to the ten most interesting ones. This choice we presented and discussed with the larger group.
The feedback session turned our process around. By the reaction of our peers and from the feedback of our tutors, we understood that the knowledge gap and the absence of transparency of the BigData handling processes are the most critical issues for us to concentrate upon.
Week 2:
After the focus of our project was decided, we moved on to the next phase - idea development. Now, the most challenging was to understand how to handle the knowledge gap: how do we explain the imbalance of power and the lack of transparency within technology? The bundle of processes and issues seemed to be huge. It took us a couple of days to discuss and agree on the definitions of terms within our small group, so how do we explain it to the rest of the world in a concise, compact, and meaningful way?
The answer to this problem was to find a metaphor in something that everybody knows, to connect in the audience's mind something that they are already familiar with that what we wanted to communicate, to find a simple key to unlock the door to the complex issue.
That key turned out to be the Little Red Riding Hood fairy-tale. Everybody knows it and remembers the plot in its essence. It also fits perfectly in the context of our idea: there is an innocent victim role for showing the internet user who doesn't know about their data being collected and sold, there is a purposeful villain role representing the people/companies that are ready to use any advantage to reach their goals. The only missing part was the one that would represent the internet companies with their ability to collect, analyze and sell the data on their users. That was the role for us to play. So agreeing on using the fairy-tale as a basis and a metaphor was the decision that defined our project.
Week 3:
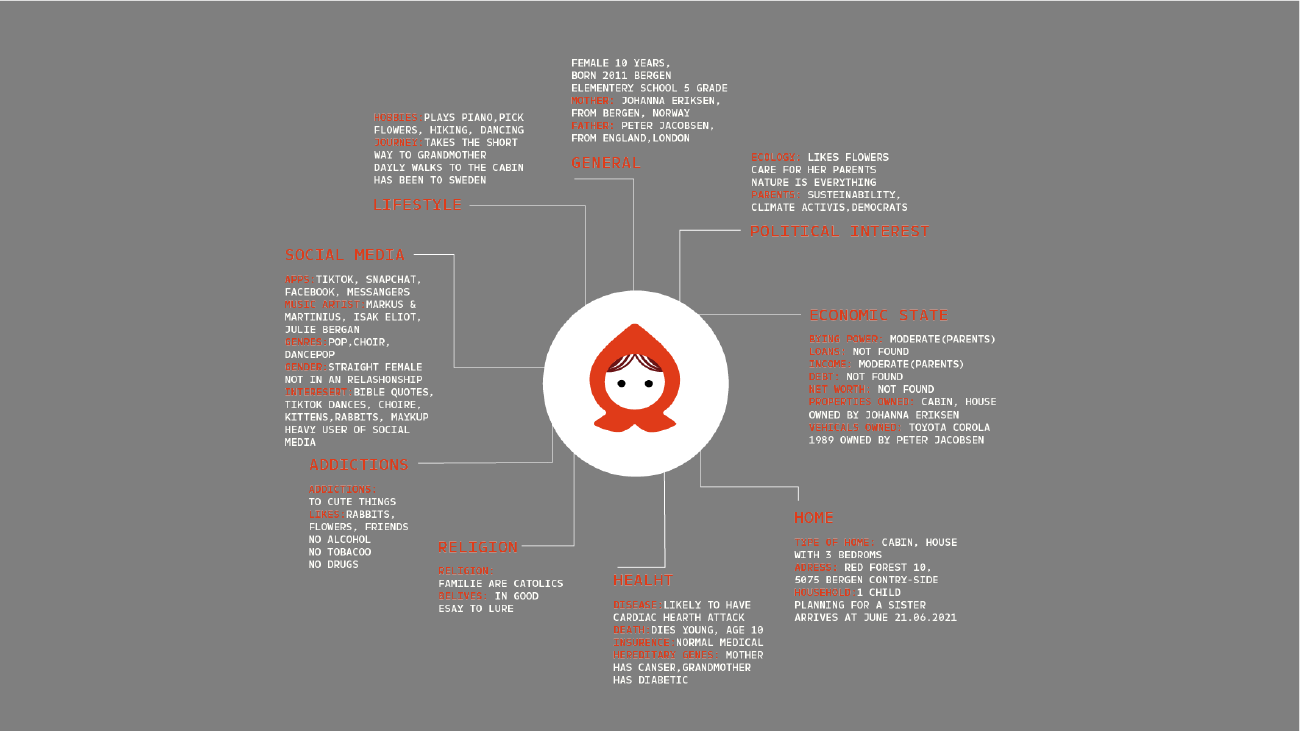
During this week, we made most of the specific decisions about the project. We decided that it would be an experience, defined the roles further, thought about what kind of data on the girl we were going to sell to our wolves (so that it is based on the facts from our research). We also decided upon the components of the experience.
Tapping into the strengths of the members of our group helped to make these decisions. It was going to consist of an interactive projection part (driven by Sara's interest to learn and use TouchDesigner software), a virtual reality part (coming from Alisa's interest in VR), a printed booklet (based on the extensive previous MA research on technology done by Nathalie), and the experience introduction screen. Kaho's ability to quickly and esthetically visualize our ideas helped us throughout the whole process in communicating our plans to each other and the tutors, and the rest of the group.
Week 4:
After all the decisions were made and the tasks defined, all that remained was to make the experience.
THE RESULT
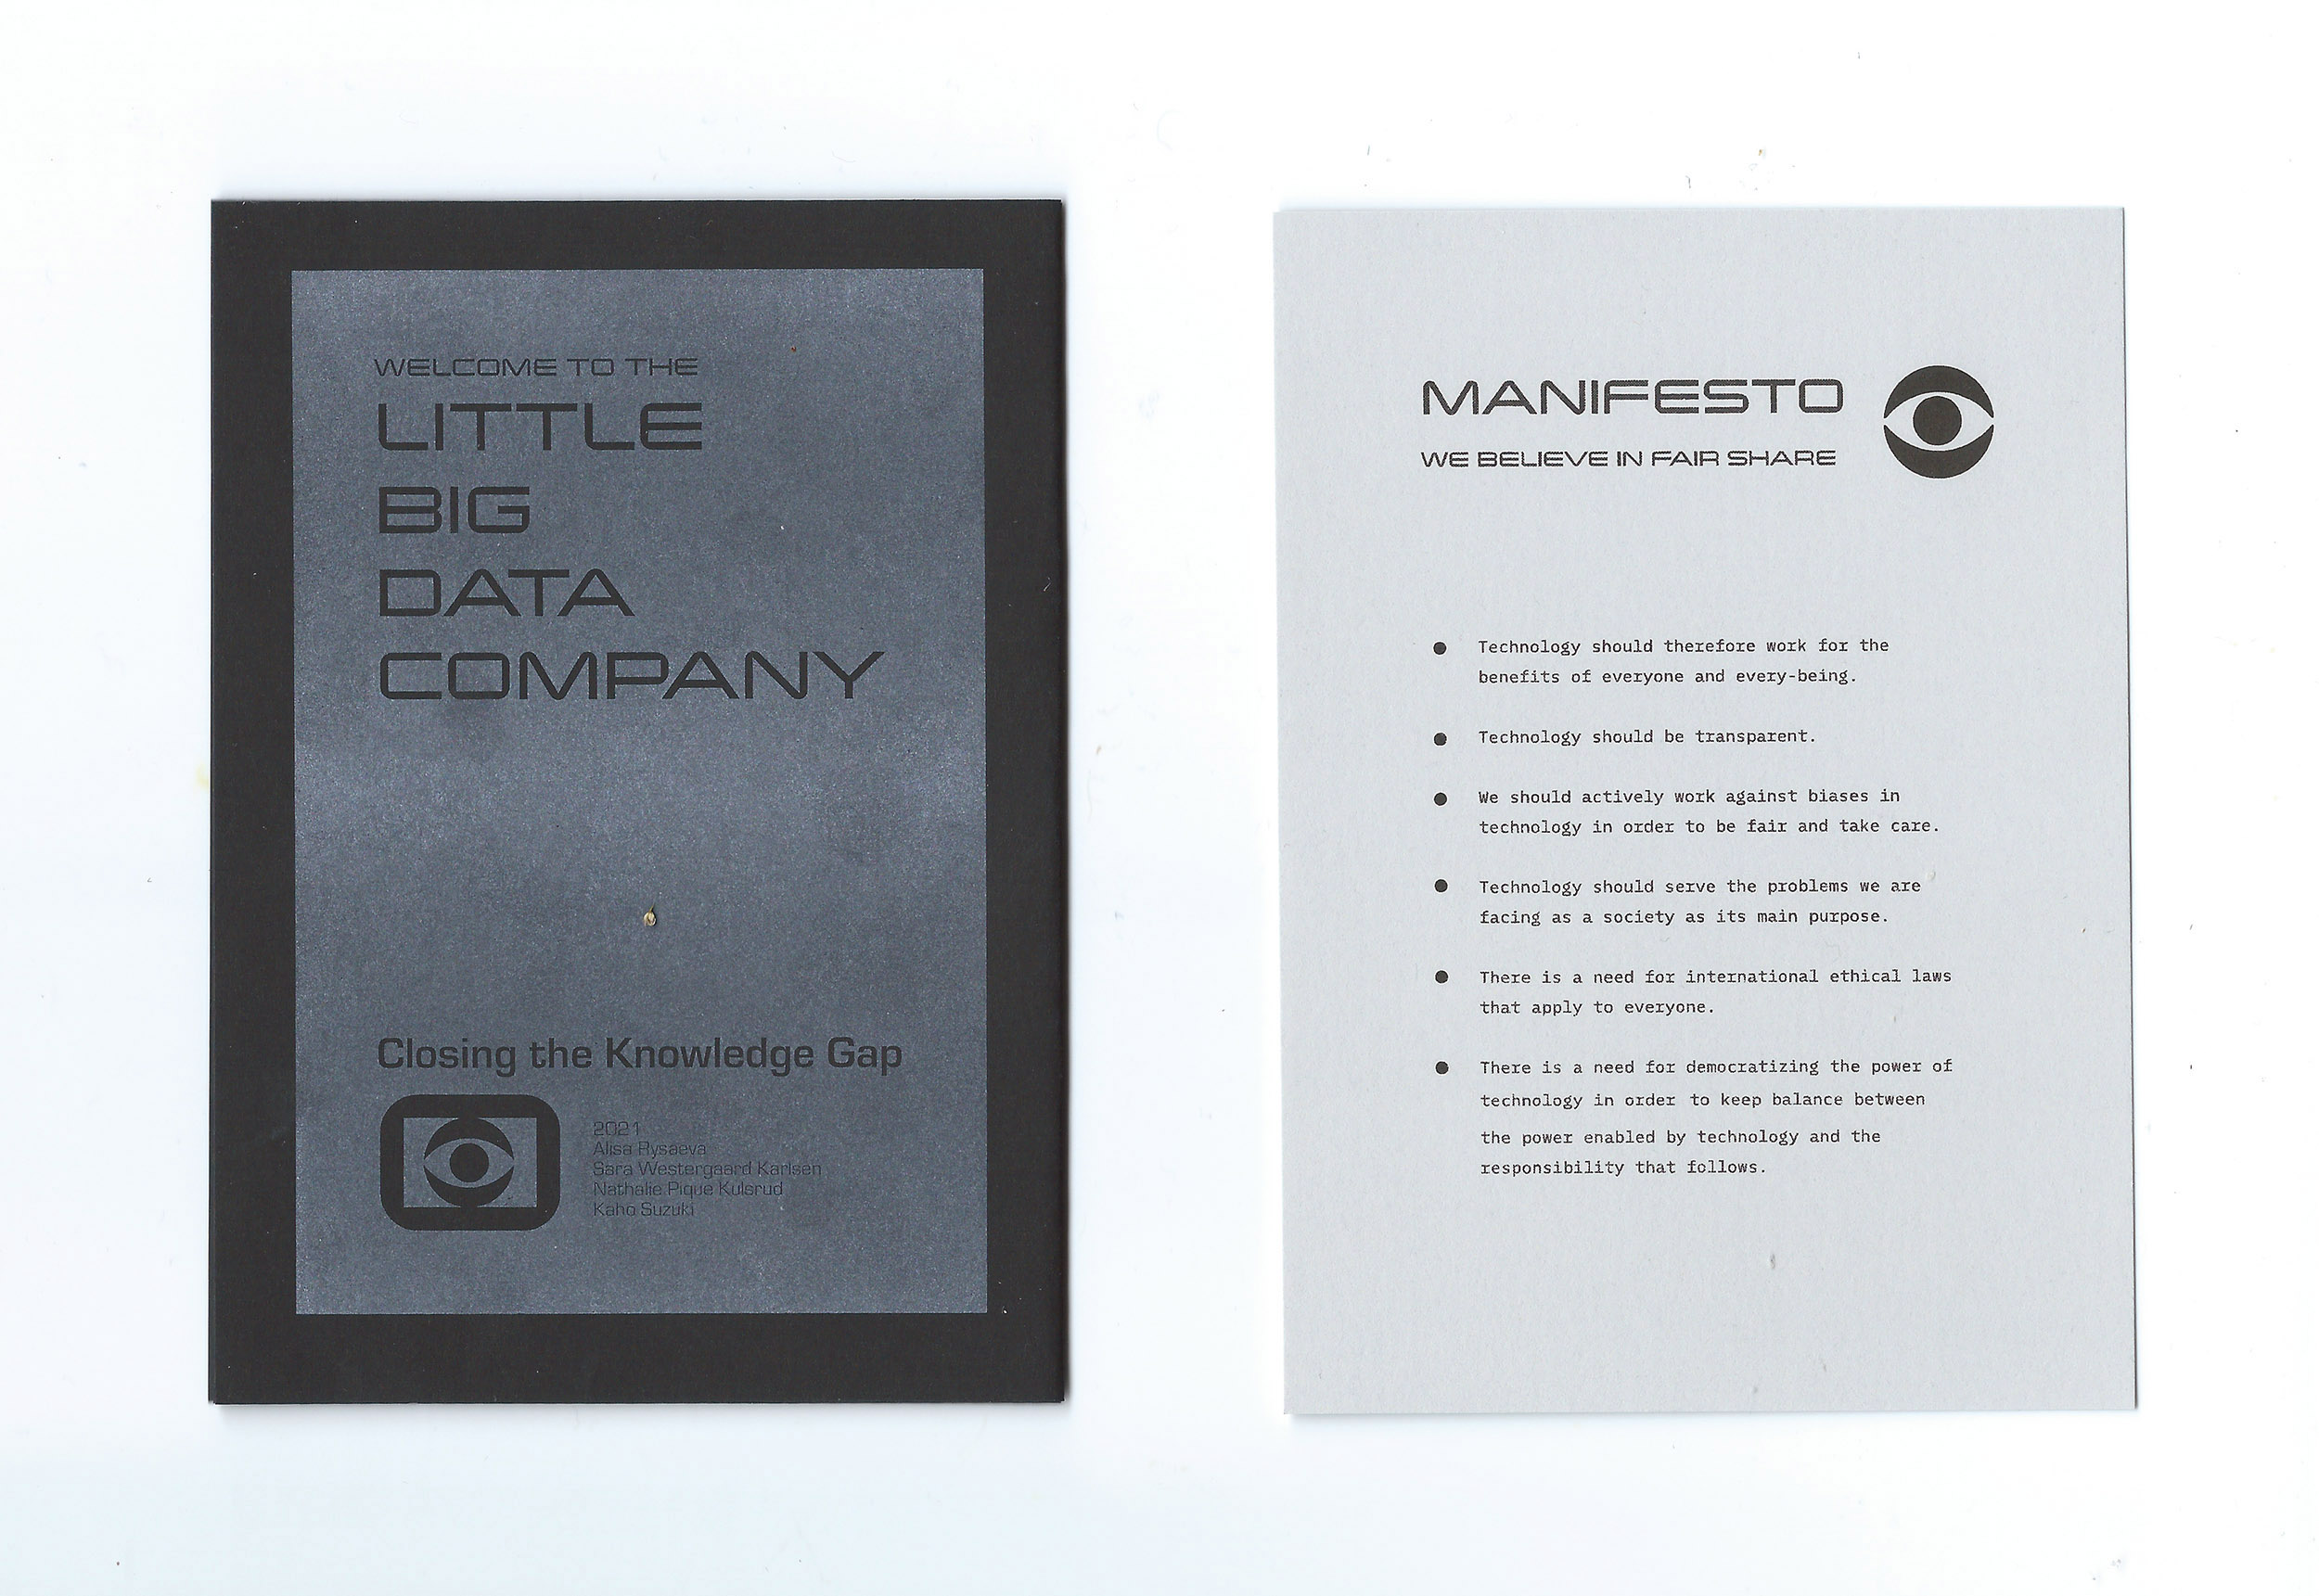
MANIFESTO
We believe that:
- Technology should work for the benefit of everyone and every being.
- Technology should be transparent.
- We should actively work against biases in technology in order to be fair.
- Technology should serve the problems we are facing as a society as its main purpose.
- There is a need for international ethical laws that apply to everyone.
- There is a need to democratize the power of technology in order to keep a balance between the power enabled by technology and the responsibility that follows.
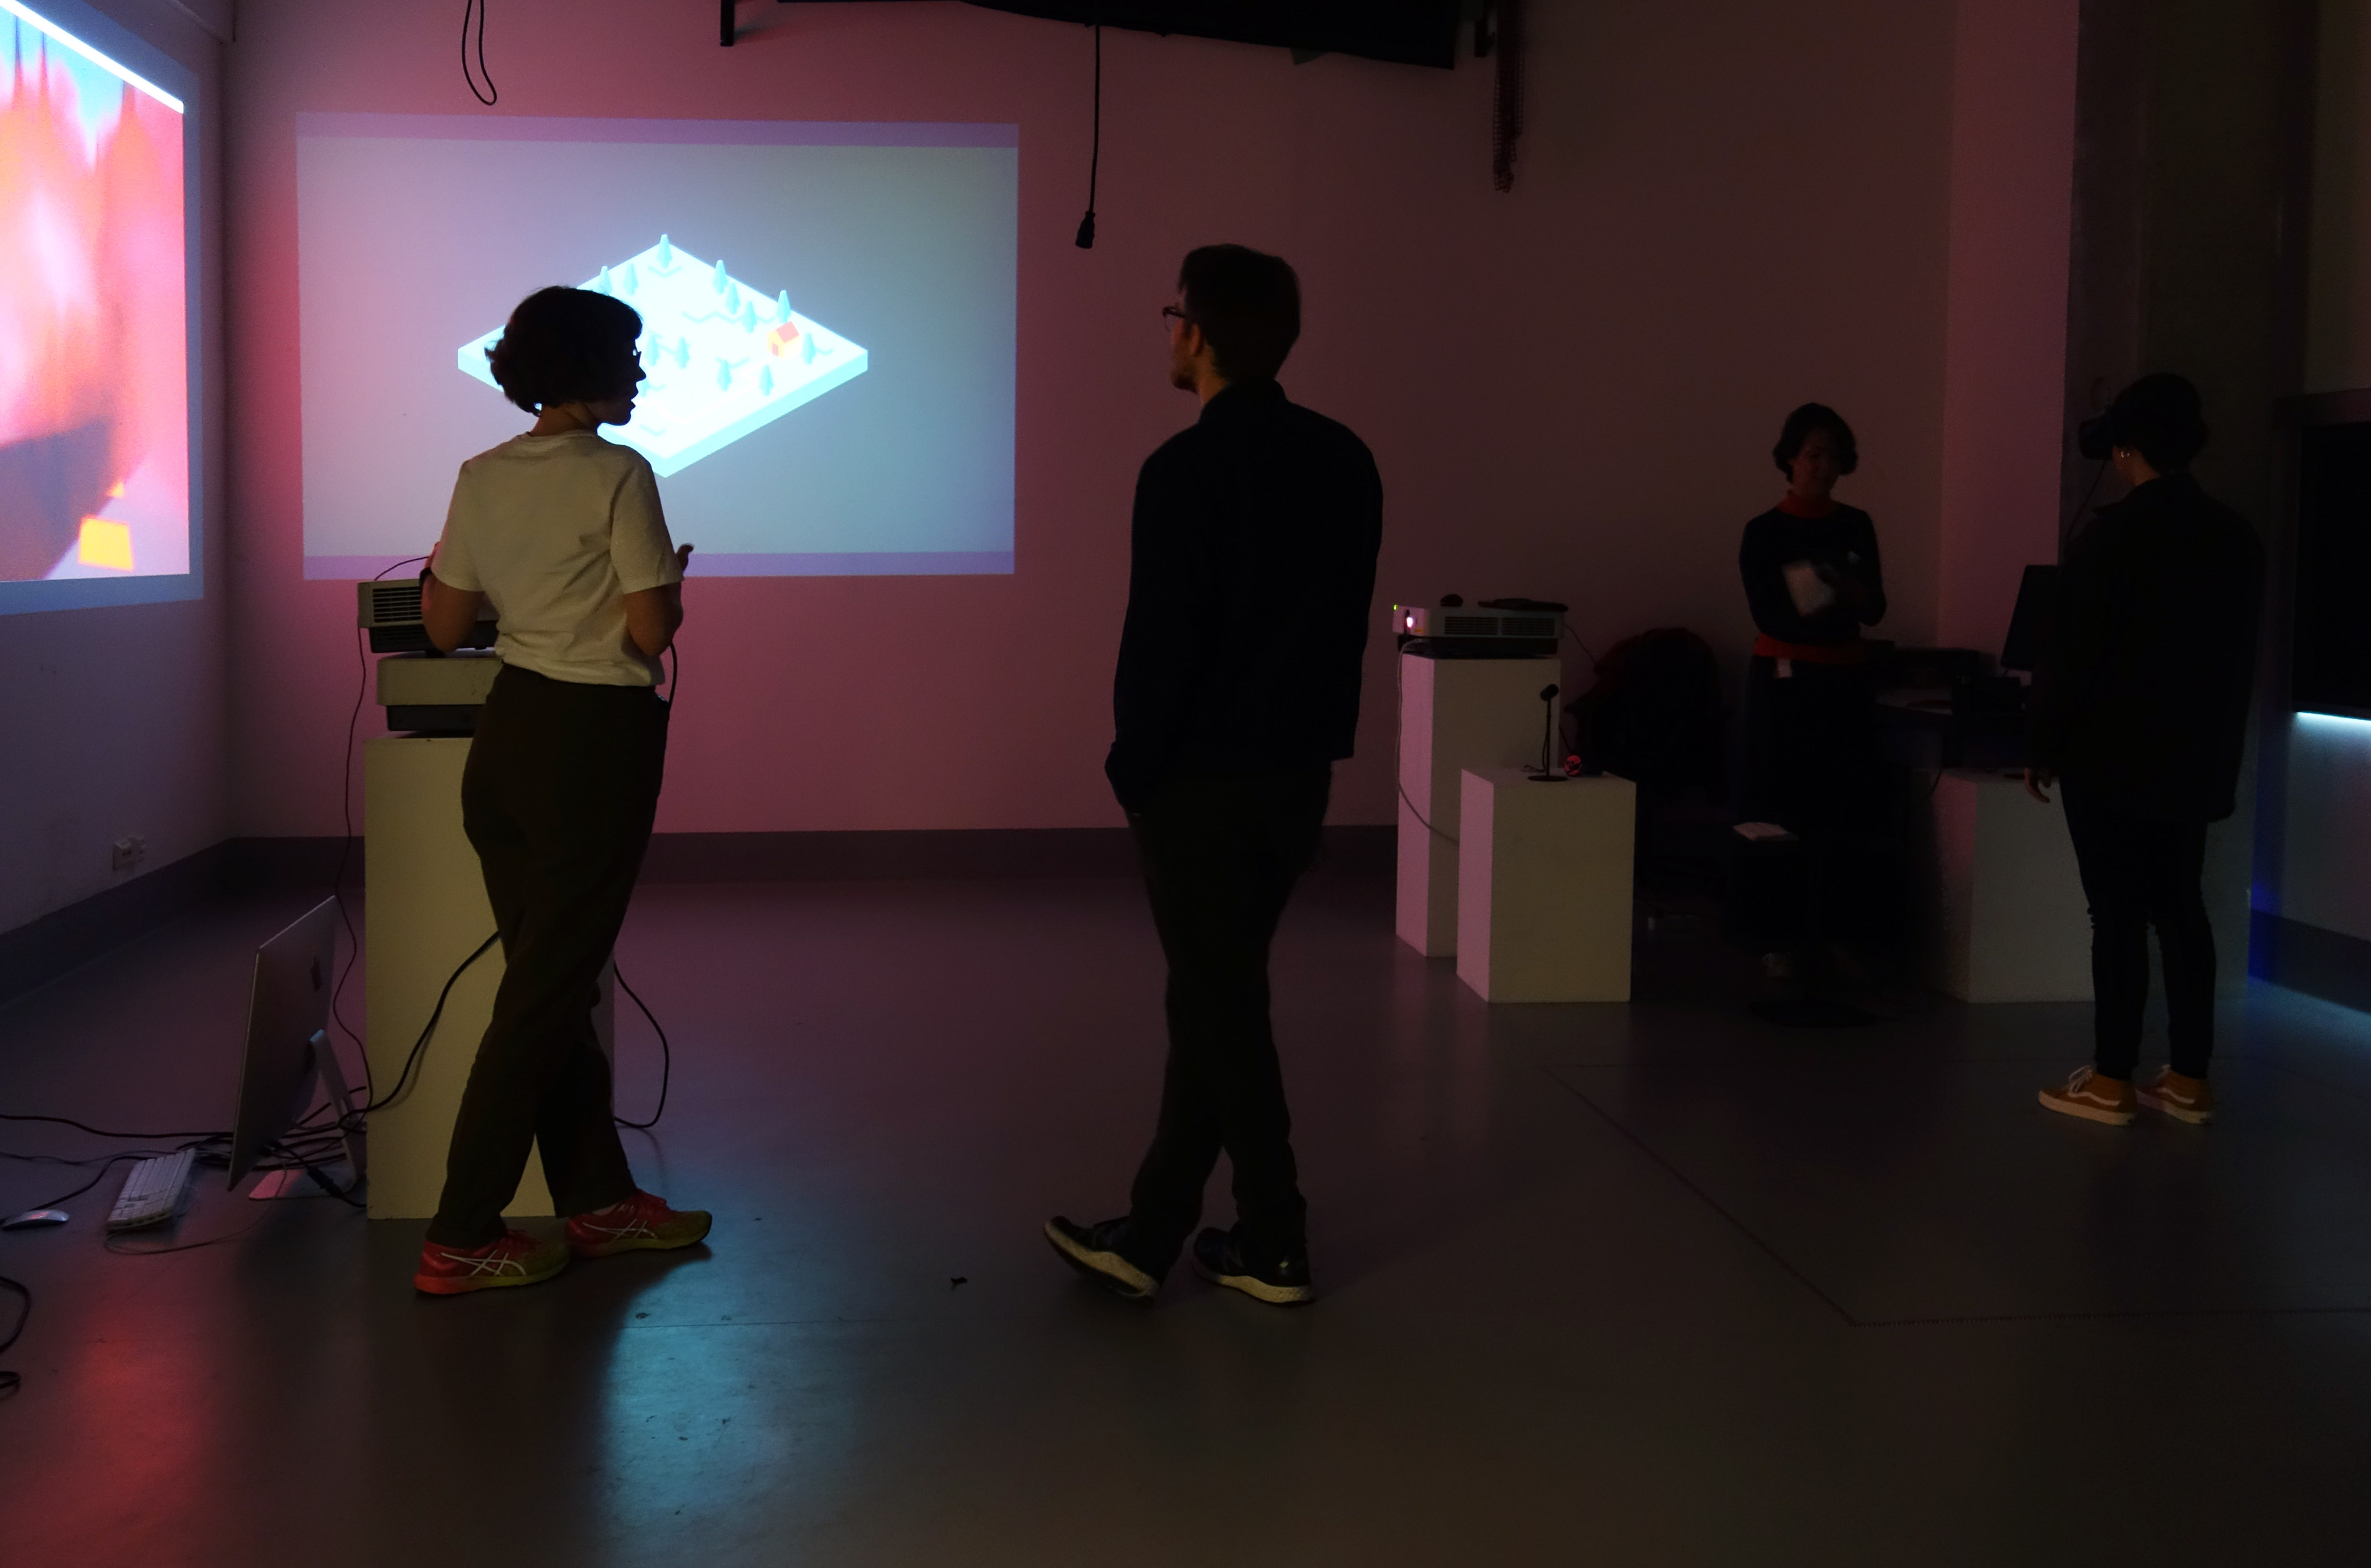
THE EXPERIENCE
1. The visitors were met with a big screen with the introductive information about the experience and the roles.
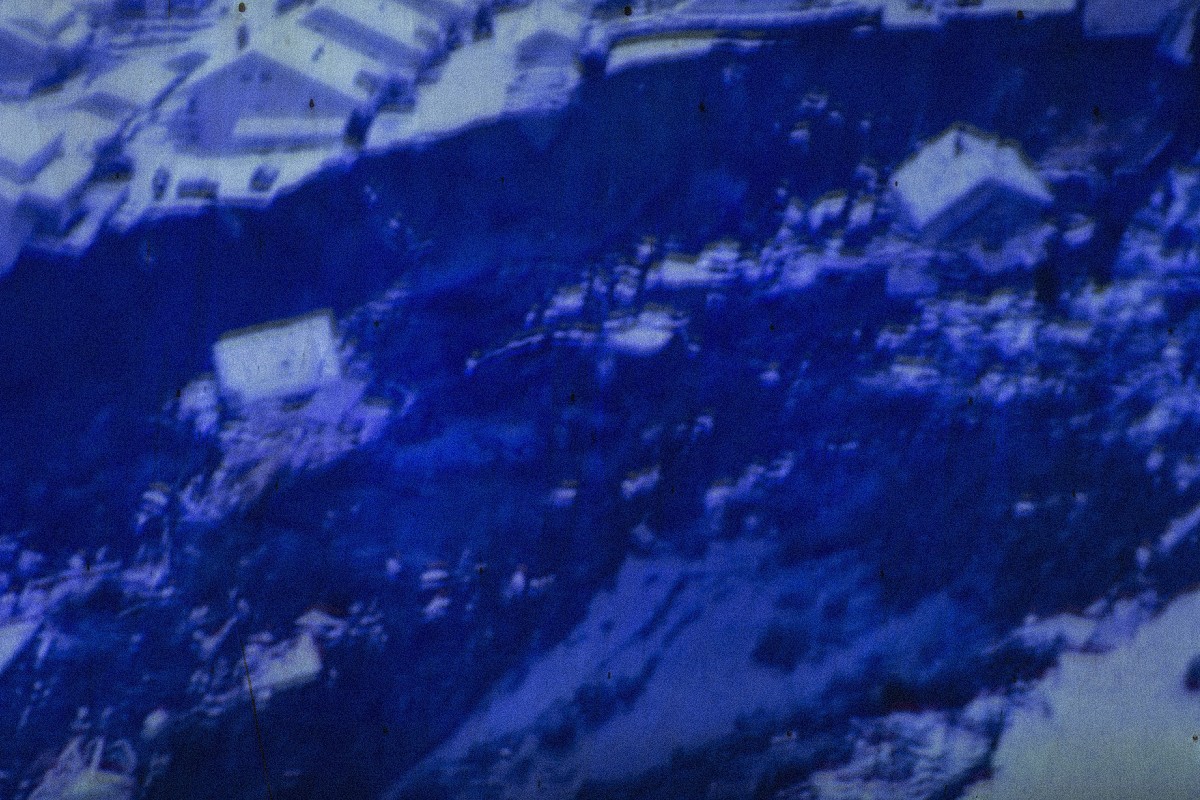
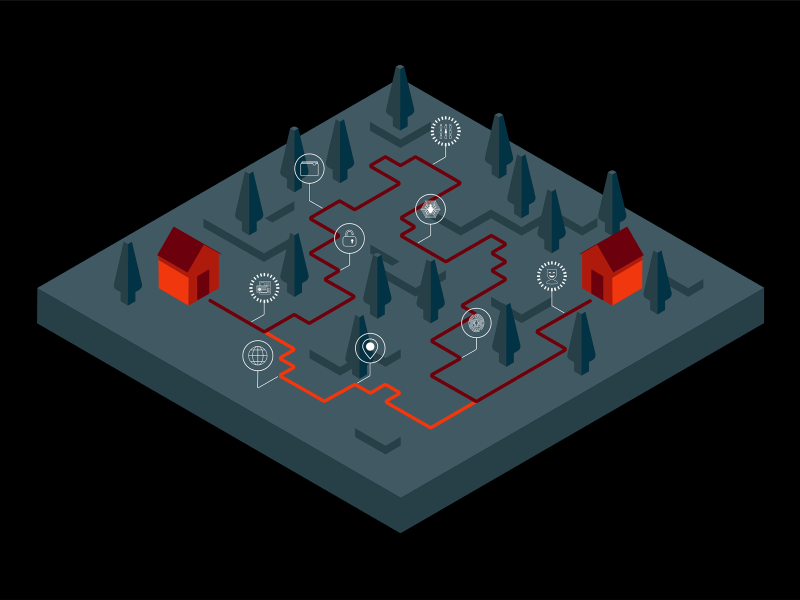
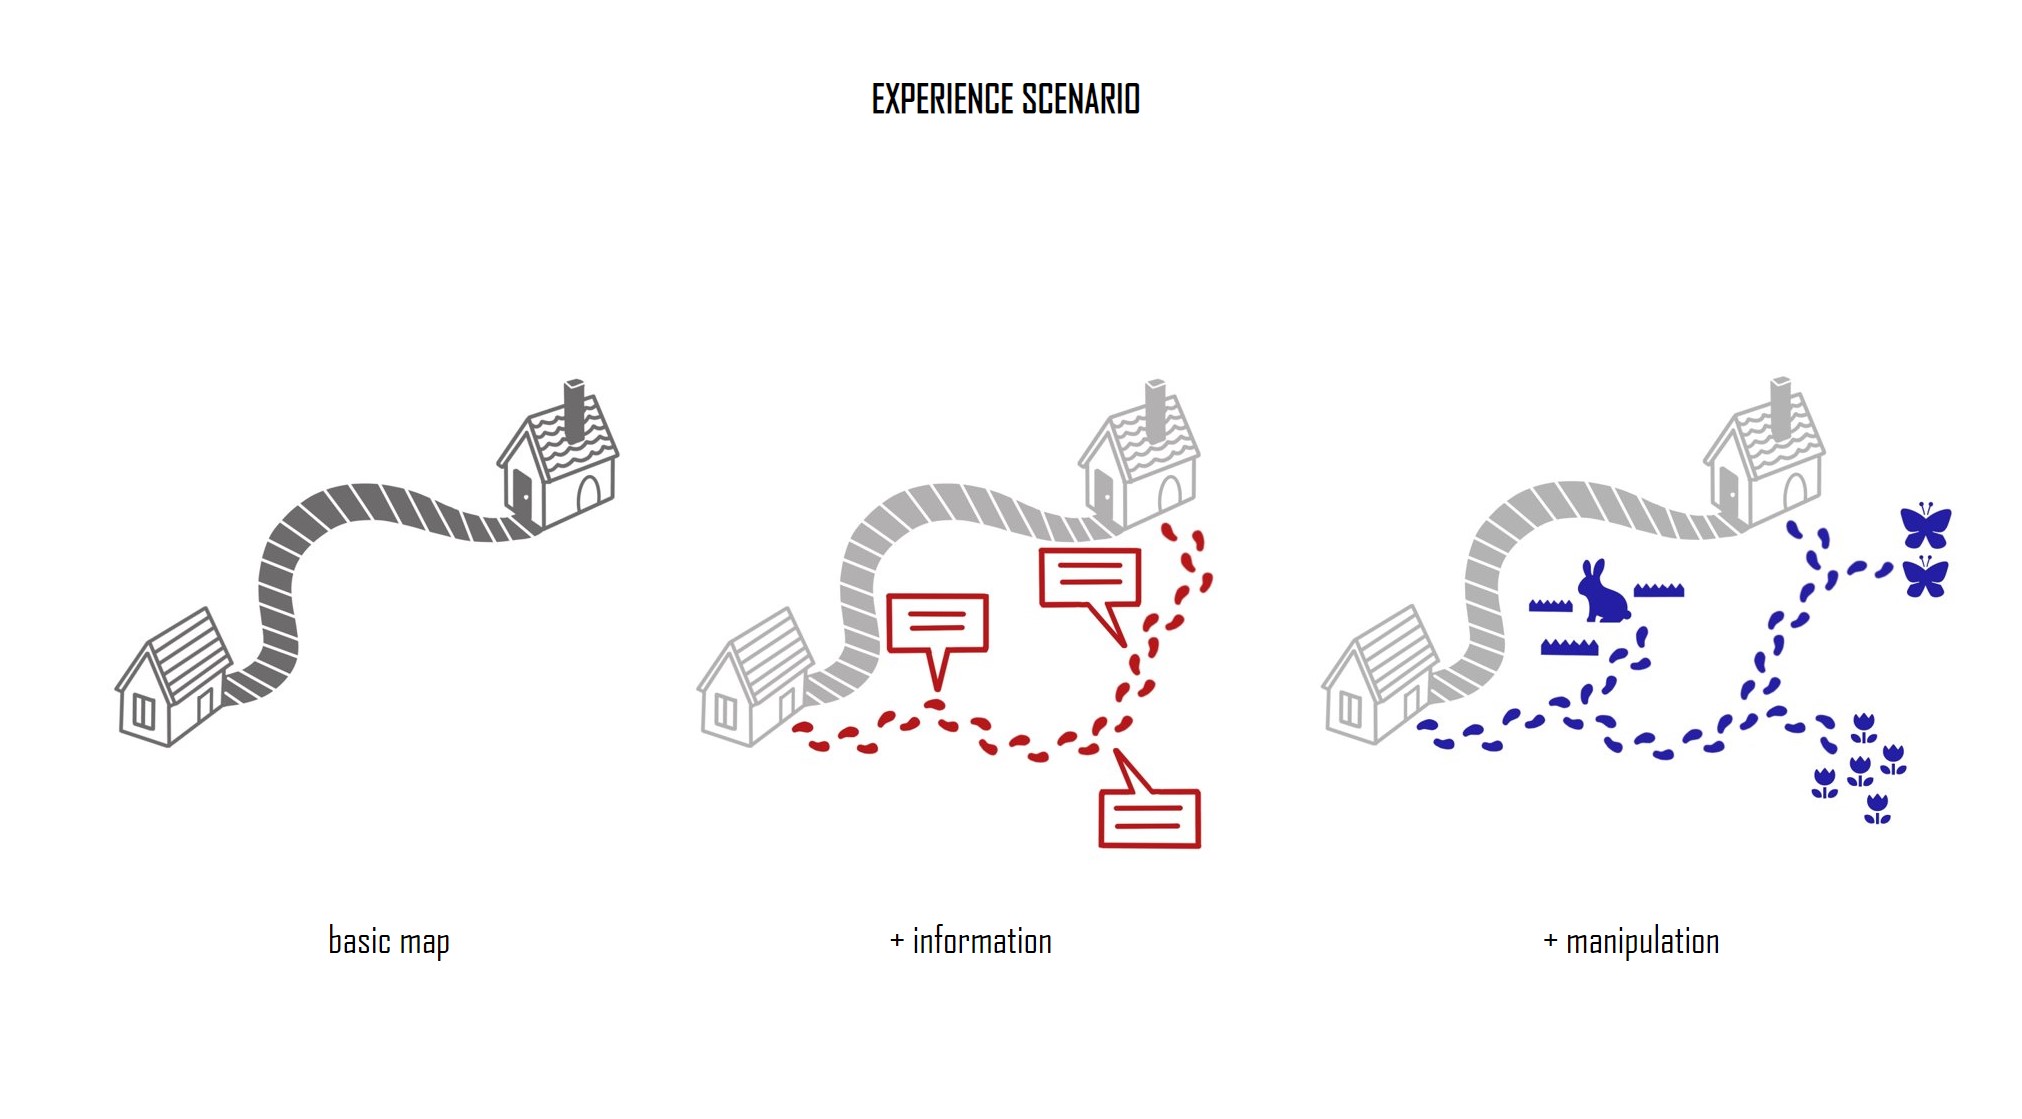
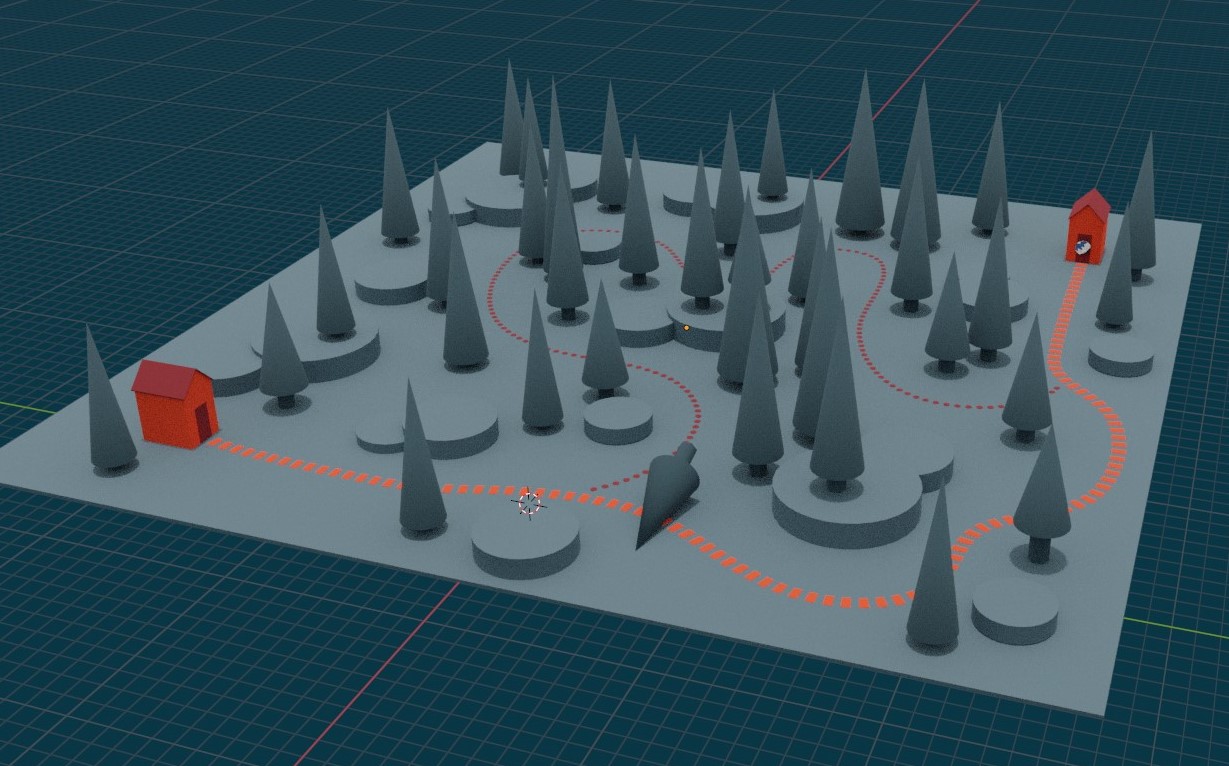
2. On one of the walls, an interactive projection served to demonstrate the map of the girl's route from her house to her grandma's house with all the information and manipulation points that we, as data brokers, could offer to our wolf clients.
The initial screen showed the basic map with the information that everybody already knows about: the two houses and the main route between them. A small keyboard controlled the projection interaction. The first button showed the initial screen.
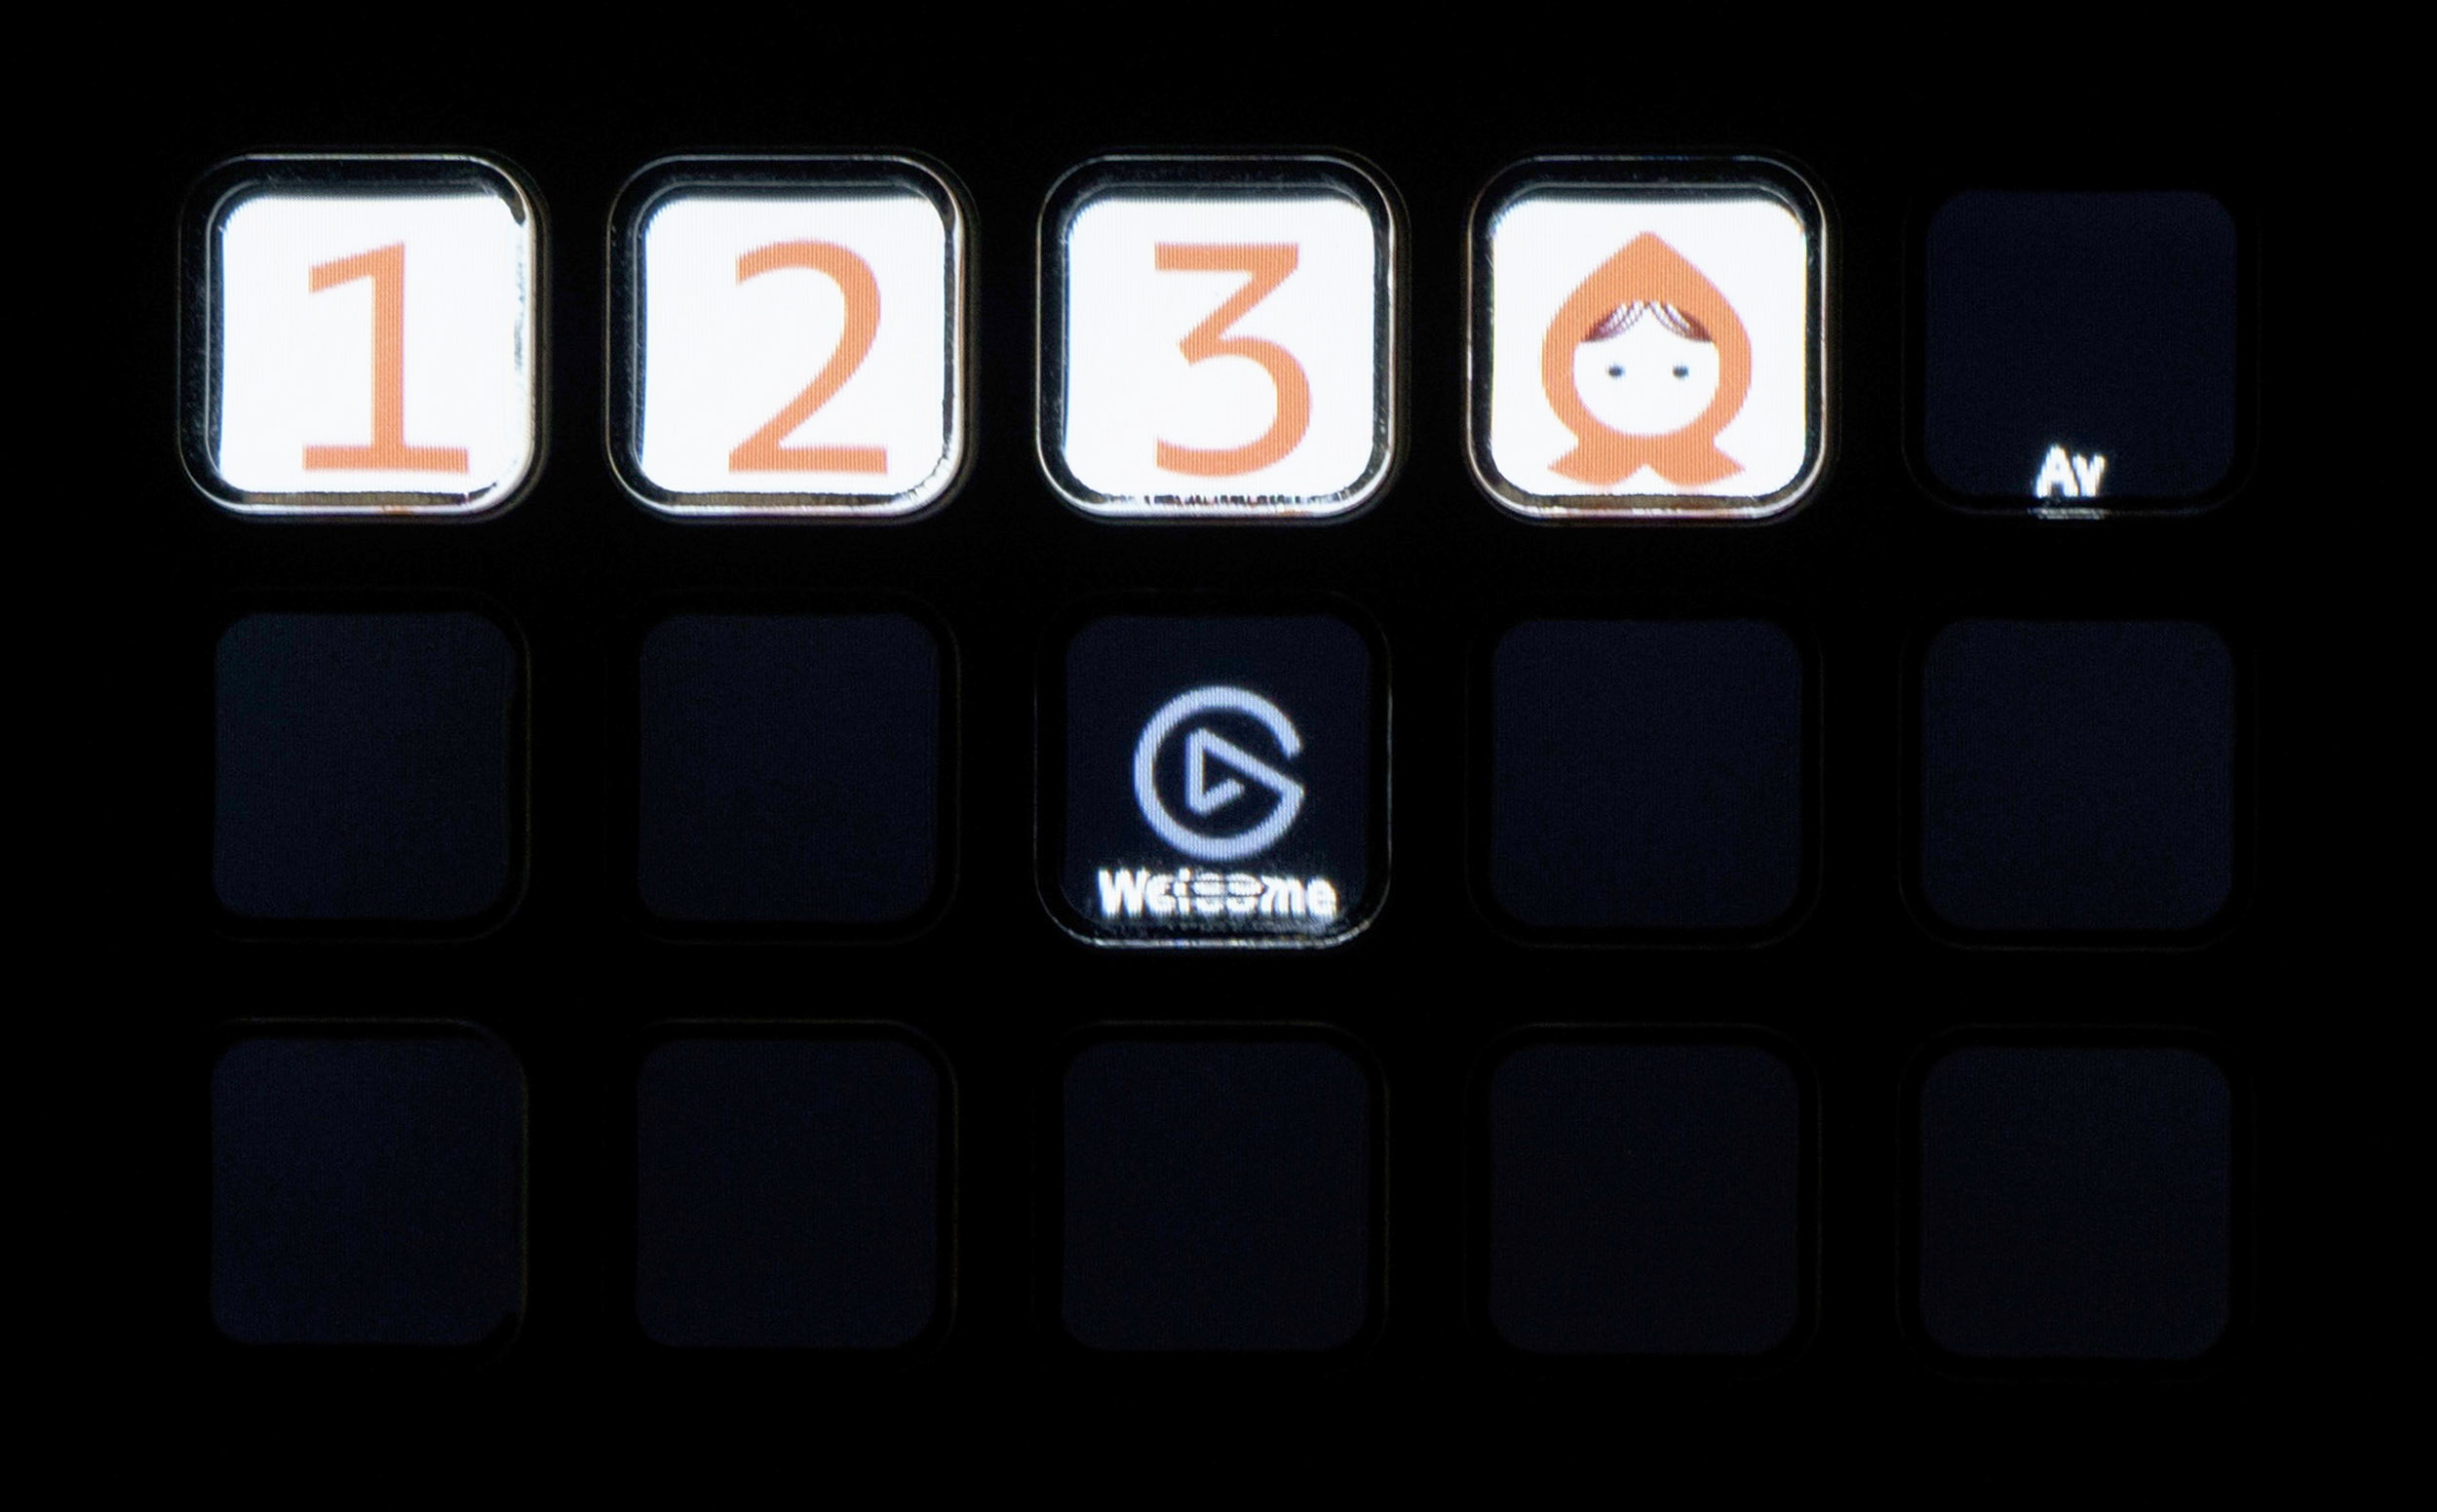
The second button showed the extra information layer package that we offered to the wolves. It revealed the existence of the second unofficial route to the grandmother's house and some other information of the girl's habits: average speed of her walk, habits on the road, and possible distraction points. Having this information, the wolf could make better decisions about his behavior. For example, he could take the alternative route, and given that he moved pretty quickly, come to the grandma's house 5-8min earlier than the girl, which would give him some time to eat the grandmother and try to impersonate her in order to lure the girl in. This package gave the wolf a 98% chance to eat the grandma, but only a 45-50% chance to eat both women.
The third button opened the last, most exciting manipulation package. If the wolf agreed to buy this package, he could also manipulate the girl's surroundings to make her behave the way that benefits him. For example, he could make a tree fall down across the main route and make the girl take the longer path and spend more time on her way, giving the wolf more time to successfully eat the grandmother and dress up to impersonate her more convincingly, increasing his chances up to 97% probability to eat both the grandmother and the girl.
3. After the wolf had bought the package he found most attractive, we could demonstrate how it works from the girl's point of view. This was where the VR part was presented. VR allowed us to show a designed and fully controlled environment that we (the data brokers) could change and manipulate while "the girl" was wearing the VR headset, demonstrating the power of the manipulation package. For example, we could make some balls appear for the girl to play with (and slow her down on her way to her grandma), or we could make a tree fall on her short route and make her take the other path.
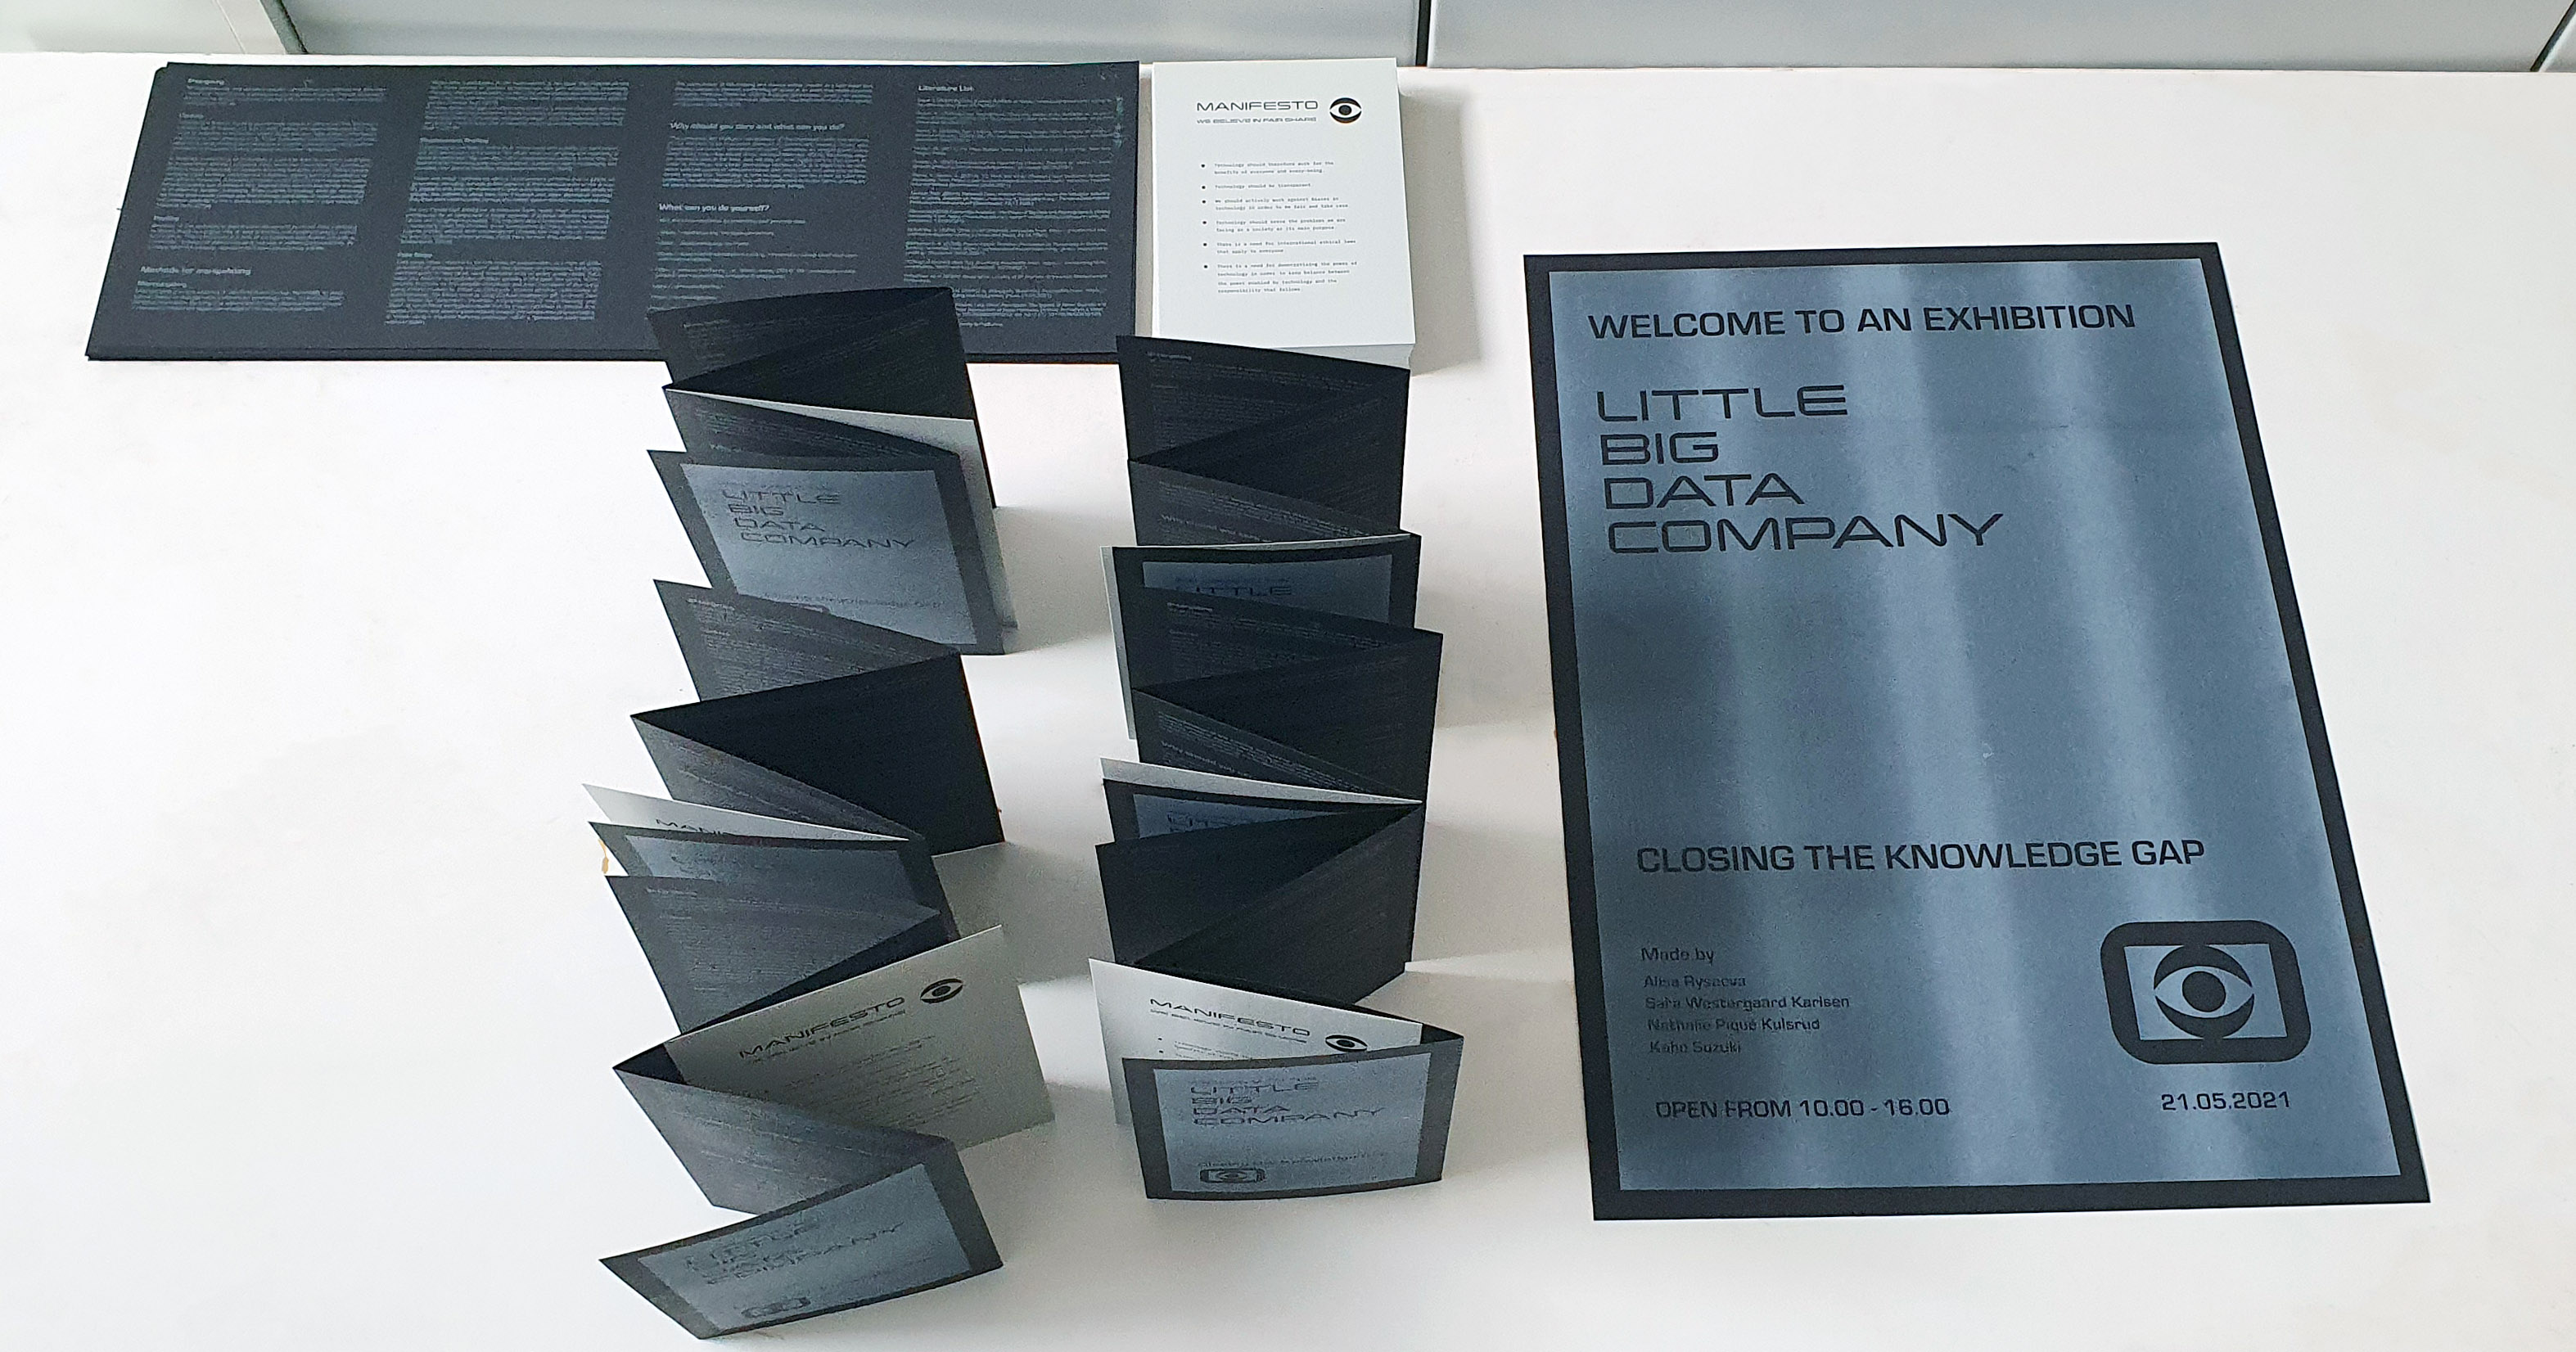
4. After the experience was over, the visitors had a chance to take away a riso-printed booklet with more in-depth information about the internet phenomena that we based our experience scenario on, as well as some links to some ways to protect your privacy on the internet.